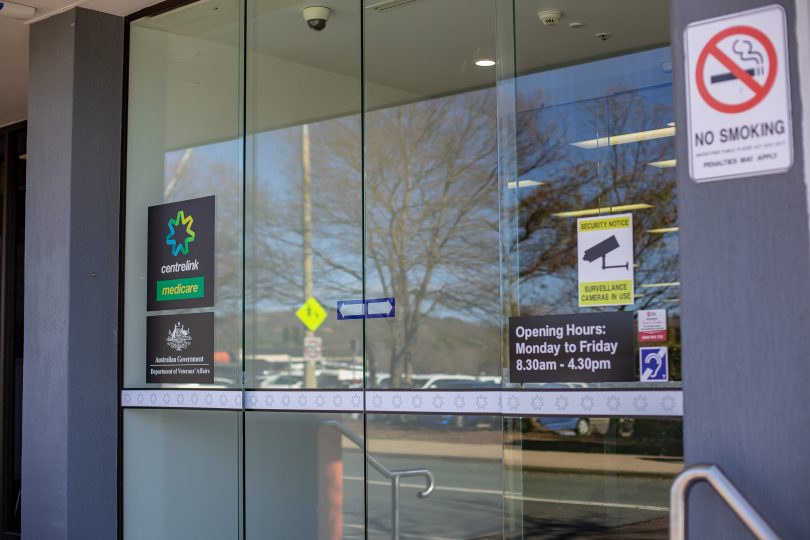
Australian Public Service numbers are spreading around the country, especially in frontline service centres. Photo: George Tsotsos.
The Australian Public Service workforce is increasingly spreading around the country, including in regional strongholds, according to statistics from the latest APS Employee Dataset (APSED) release.
While Canberra hosts the largest single group of public servants, there are cumulatively more APS employees working outside of the ACT.
The nationwide APS headcount on 30 June this year stood at 198,529 – up 7.4 per cent from 184,858 the previous year.
Of those, 70,221 are in the ACT, with New South Wales and Victoria hosting more than 33,000 each.
In NSW, there are 33,646 employees, with 9824 in the state’s regions (555 in the Illawarra and 325 in the Riverina).
Victoria has 35,679 staff, with 5514 located regionally.
Queensland hosts 26,448 APS employees, with 6987 in the regions.
Of Queensland’s regional count, Townsville is home to 1969 staff and Cairns has 1129.
After the nation’s capital and the three biggest states (in population), South Australia has 14,111 APS employees; Western Australia has 9839; Tasmania 4734; and the Northern Territory 2255.
Services Australia has the largest employee headcount at 35,210, with many spread around the nation at frontline Centrelink and Medicare offices.
The Australian Taxation Office is next with 21,436 employees, followed closely by the Defence Department with 20,545.
Home Affairs has 15,949 staff, with 5633 of them based in the ACT.
The total number of APS employees based overseas comes in at 1596.
Cultural diversity of employees has risen marginally at the ATO and Services Australia, with other agencies lagging on that front.
APSED lists 6640 culturally and linguistically diverse (CALD) employees at the ATO and 7,612 at Services Australia.
Across the service, 38,979 staff are listed as CALD.
Women account for 111,460 of the total APS employee headcount; Indigenous Australians total 6191; and employees with disabilities account for 10,988.
There are 120,484 APS employees whose country of birth is Australia, followed by 7229 whose country of birth is India; 3949 England; and 2566 China.
This release of APSED data presents a statistical outline of the APS workforce employed under the Public Service Act 1999. It provides key workforce metrics as at 30 June 2025, along with trend data.
This data complements the Australian Public Service Commissioner’s annual State of the Service Report, which draws on a range of information sources, including the biannual June data release.
Each year, a snapshot of data covering all APS employees as at 30 June and 31 December is released by the Australian Public Service Commission, from data provided by agencies and drawn from the Australian Public Service Employment Database.
This data release covers 102 APS agencies, with any agencies without APS staff as at 30 June 2025, excluded from reporting.
“The reported size of the APS workforce is a headcount of all people employed at the time of the snapshot,” the release states.
“This figure does not adjust for hours worked and it includes any employees who are on extended leave, including those on maternity leave and leave without pay.
“Headcount is different to Average Staffing Level (ASL) data provided in the Federal Budget papers.
“The ASL counts staff for the time they work. For example, a full-time employee is counted as one ASL, while a part-time employee who works three full days per week contributes 0.6 of an ASL.
“The ASL averages staffing over an annual period. It is not a point-in-time calculation.”
APS employment data includes demographic variables, including age, gender and work location; classification level of APS employees, from trainee to Senior Executive Service; diversity data, including voluntary items self-reported by APS staff, such as disability status, Indigenous status, and cultural diversity; and staff movements, including engagements, separations, promotions and transfers between agencies.
A full set of data tables is available in an Excel workbook that can be downloaded from the APSC’s website.
Original Article published by Chris Johnson on Region Canberra.